什么叫动态调试
将程序运行起来,通过打断点、打印等方式,查看参数、返回值、函数调用流程等。
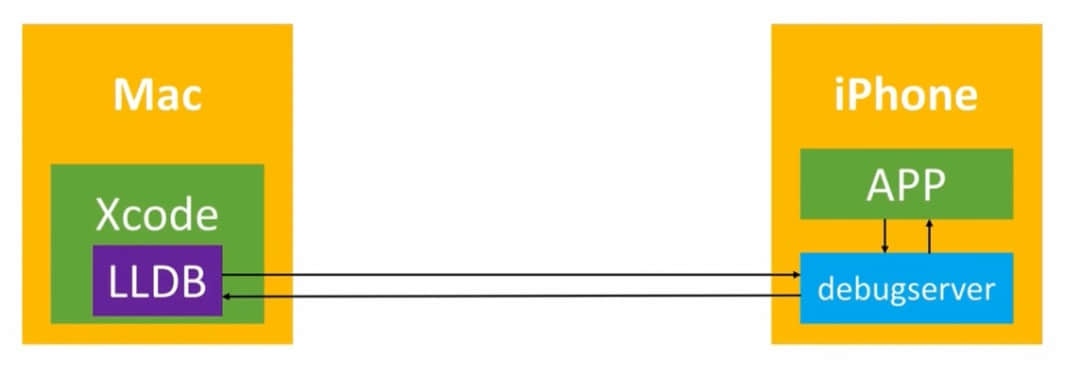
Xcode的动态调试原理
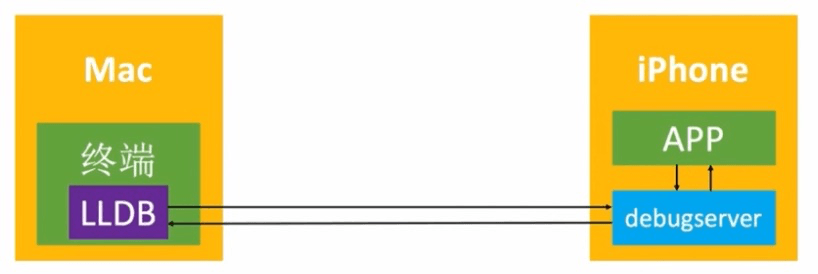
LLDB:是一个开源的内置于 Xcode 的具有 REPL(read-eval-print-loop) 特征的 Debugger,其可以安装 C++ 或者 Python 插件。
debugserver:作为连接 LLDB 和 APP 之间的桥梁。
Xcode 一般只能调试通过 Xcode 直接编译运行安装到手机上的 APP,不能直接调试第三方 APP。
debugserver 如何自动安装到手机上
debugserver 一开始存放在 Xcode 里,路径位于
/Applications/Xcode.app/Contents/Developer/Platforms/iPhoneOS.platform/DeviceSupport/iOS系统版本号 下的 DeveloperDiskImage.dmg 里的 usr/bin/debugserver。

当 Xcode 识别到手机设备时,会自动将 debugserver 安装到手机上,安装后位于 /Developer/usr/bin。
iPhone-X:/Developer/usr/bin root# ls -l
total 676
-rwxrwxr-x 1 root admin   135024 Sep  4  2020 DTDeviceArbitration*
-rwxrwxr-x 1 root admin   135296 Sep  4  2020 ScreenShotr*
-rwxrwxr-x 1 root admin   299088 Sep  4  2020 axauditd*
-rwxrwxr-x 1 root admin 10013216 Sep  4  2020 debugserver*
关于GCC、LLVM、GDB、LLDB
动态调试任意APP
环境配置
重签名debugserver
通过 Xcode 安装到手机上的 debugserver 权限不够,只能调试通过 Xcode 安装到手机上的 APP,所以我们要给 debugserver 签入足够的权限。
将手机上的 debugserver 文件拷贝到电脑上,也可以直接从 Xcode 中找到适合我们手机系统的版本:
➜ scp -P 2222 root@localhost:/Developer/usr/bin/debugserver ~/Desktop/debugserver查看 debugserver 架构:
➜  lipo -i debugserver
Architectures in the fat file: debugserver are: arm64 arm64e
如果是 Fat 格式,可以拆分架构:
➜  lipo debugserver -thin arm64 -output debugserver-arm64
➜  lipo debugserver -thin arm64e -output debugserver-arm64e
保留你需要的架构并重新改名为 debugserver,其余可删除。
将下面权限内容保存为 debugserver.entitlements,已在 unc0ver6.1.1 + iOS14.0 环境下测试可用(其余越狱工具和iOS系统版本可以看这里):
<?xml version="1.0" encoding="UTF-8"?>
<!DOCTYPE plist PUBLIC "-//Apple//DTD PLIST 1.0//EN" "http://www.apple.com/DTDs/PropertyList-1.0.dtd">
<plist version="1.0">
<dict>
    <key>com.apple.backboardd.debugapplications</key>
    <true/>
    <key>com.apple.backboardd.launchapplications</key>
    <true/>
    <key>com.apple.frontboard.debugapplications</key>
    <true/>
    <key>com.apple.frontboard.launchapplications</key>
    <true/>
    <key>com.apple.private.cs.debugger</key>
    <true/>
    <key>com.apple.private.logging.diagnostic</key>
    <true/>
    <key>com.apple.private.memorystatus</key>
    <true/>
    <key>com.apple.springboard.debugapplications</key>
    <true/>
    <key>get-task-allow</key>
    <true/>
    <key>platform-application</key>
    <true/>
    <key>run-unsigned-code</key>
    <true/>
    <key>task_for_pid-allow</key>
    <true/>
</dict>
</plist>提示:如果不想拆分架构,可以将整个权限内容在权限文件里多粘贴一次,让内容重复:

给 debugserver 重新签入权限:
➜ ldid -Sdebugserver.entitlements debugserver将重签名后的 debugserver 拷贝到手机上的 /usr/bin 目录:
➜ scp -P 2222 ~/Desktop/debugserver root@localhost:/usr/bin/debugserver通过 ssh 登录手机,并给 debugserver 加上可执行权限:
iPhone-X:~ root# chmod +x /usr/bin/debugserver让debugserver附加到某个APP进程
iPhone-X:~ root# debugserver localhost:debugserver服务的端口号 -a 进程ID/进程名比如附加到微信:
iPhone-X:~ root# debugserver localhost:2223 -a WeChat
debugserver-@(#)PROGRAM:LLDB  PROJECT:lldb-1200.2.12
 for arm64.
Attaching to process WeChat...
Listening to port 2223 for a connection from localhost...
LLDB连接手机上的debugserver
进入 LLDB 调试器环境:
lldb退出 LLDB 调试器环境:
(lldb) exit连接手机上的 debugserver 服务:
(lldb) process connect connect://手机IP地址:debugserver服务的端口号为了传输速度更快,也将 debugserver 服务的端口号做个映射(之前笔记有写):
python ~/DevEnv/usbmuxd/tcprelay.py -t 2223:2223用 USB 将手机连接电脑后,使用映射端口连接手机上的 debugserver 服务:
(lldb) process connect connect://localhost:2223
Process 21781 stopped
* thread #1, queue = 'com.apple.main-thread', stop reason = signal SIGSTOP
    frame #0: 0x00000001d3e5b8c4 libsystem_kernel.dylib`mach_msg_trap + 8
libsystem_kernel.dylib`mach_msg_trap:
->  0x1d3e5b8c4 <+8>: ret

libsystem_kernel.dylib`mach_msg_overwrite_trap:
    0x1d3e5b8c8 <+0>: mov    x16, #-0x20
    0x1d3e5b8cc <+4>: svc    #0x80
    0x1d3e5b8d0 <+8>: ret
Target 0: (Reading) stopped.
使用 LLDB 的 c(也就是 continue )命令,让程序先继续运行:
(lldb) c
Process 21781 resuming
通过debugserver启动APP
iPhone-X:~ root# debugserver -x auto localhost:debugserver服务的端口号 APP的可执行文件路径常用LLDB指令
指令的格式:
<command> [<subcommand> [<subcommand>...]] <action> [-options [option-value]] [argument [argument...]]<command>:命令<subcommand>:子命令<action>:命令操作<options>:命令选项<argument>:命令参数
help
help <command> 查看指令的用法:
(lldb) help breakpoint
(lldb) help breakpoint set
expression
expression <cmd-options> --<expr> 执行一个表达式:
-
--:命令选项结束符,表示所有的命令选项已经设置完毕,如果没有命令选项,-- 可以省略 -
<expr>:需要执行的表达式
expression、expression -- 和指令 print、call、p 的效果一样
(lldb) p self.view.backgroundColor = [UIColor redColor]expression -O -- 和指令 po 的效果一样。作用是:如果可能,使用特定语言的 description API 进行显示。
(lldb) p self.view
(UIView *) $0 = 0x00007f8ff7d06b80

(lldb) po self.view
<UIView: 0x7f8ff7d06b80; frame = (0 0; 375 812); autoresize = W+H; layer = <CALayer: 0x600001ac4b60>>
po [类名 _shortMethodDescription] 打印类的属性和方法信息:
(lldb) po [CriusContainerView  _shortMethodDescription]
<CriusContainerView: 0x105c6f588>:
in CriusContainerView:
        Class Methods:
                + (id) currentCriusRender; (0x1029815e4)
        Properties:
                @property (copy, nonatomic) NSString* clickCommand;  (@synthesize clickCommand = _clickCommand;)
                @property (nonatomic) BOOL hasSetClickCommand;  (@synthesize hasSetClickCommand = _hasSetClickCommand;)
        Instance Methods:
                - (void) configWithCriusNode:(id)arg1 isNightMode:(unsigned char)arg2 promotionItem:(id)arg3 renderDelegate:(id)arg4; (0x102981794)
                - (double) calculateHeightWithCriusData:(id)arg1; (0x1029818ac)
                - (void) configWithCriusData:(id)arg1 isNightMode:(unsigned char)arg2 promotionItem:(id)arg3 renderDelegate:(id)arg4; (0x1029816d4)
                - (id) clickCommand; (0x102981bc0)
                - (void) setClickCommand:(id)arg1; (0x102981bd0)
                - (BOOL) hasSetClickCommand; (0x102981bdc)
                - (void) setHasSetClickCommand:(BOOL)arg1; (0x102981bec)
                - (id) init; (0x10298167c)
                - (void) .cxx_destruct; (0x102981bfc)
                - (id) hitTest:(struct CGPoint)arg1 withEvent:(id)arg2; (0x102981930)
(UIView ...)
thread
thread backtrace、bt 打印线程的堆栈信息
thread return [<expr>] 让当前函数直接返回某个值,不会执行当前函数体内断点后面的代码
thread continue、continue、c 过掉当前断点,让程序继续运行,如果有下一个断点则停在下一个断点
thread step-over、next、n 单步运行,遇到子函数会把子函数当做整体一步执行(源码级别)
thread step-in、step、s 单步运行,遇到子函数会进入子函数(源码级别)
thread step-out、finish 直接执行完当前函数的所有代码,返回到上一个函数
thread step-inst-over、nexti、ni 单步运行,遇到子函数会把子函数当做整体一步执行(指令级别)
thread step-inst、stepi、si 单步运行,遇到子函数会进入子函数(指令级别)
frame
frame variable [<variable-name>] 打印当前栈帧的变量
breakpoint
breakpoint set -a 函数地址 给指定函数地址设置断点(在终端调试别人的APP可以这样做),函数地址可以从 thread backtrace 或 bt 指令打印线程的堆栈信息中获取到
(lldb) breakpoint set -a 0x000000breakpoint set -n 函数名 给指定函数名设置断点(在Xcode中调试自己APP可以这样做)
(lldb) breakpoint set -n test1:test2: # 给所有和我们指定方法名同名的方法设置断点
(lldb) breakpoint set -n "-[TestClass test1:test2:]" # 给指定类的指定方法设置断点
breakpoint set -r 正则表达式 给所有和我们指定方法名同名的方法设置断点,支持正则模糊匹配
(lldb) breakpoint set -r test1:breakpoint set -s 动态库 -n 函数名 给指定动态库里的指定函数设置断点
(lldb) breakpoint set -s test.dylib -n test1:test2:breakpoint list 列出当前所有断点
(lldb) breakpoint list
Current breakpoints:
1: file = '/Users/feng/Code/TestApp/TestApp/ViewController.m', line = 27, exact_match = 0, locations = 1, resolved = 1, hit count = 1

  1.1: where = TestApp`-[ViewController touchesBegan:withEvent:] + 77 at ViewController.m:27:5, address = 0x000000010b072e6d, resolved, hit count = 1

2: file = '/Users/feng/Code/TestApp/TestApp/ViewController.m', line = 22, exact_match = 0, locations = 1, resolved = 1, hit count = 0

  2.1: where = TestApp`-[ViewController test1:test2:] + 77 at ViewController.m:22:5, address = 0x000000010b072ddd, resolved, hit count = 0
breakpoint disable 断点编号 禁用断点
breakpoint enable 断点编号 启用断点
breakpoint delete 断点编号 删除断点
(lldb) breakpoint disable 1
(lldb) breakpoint enable 1
(lldb) breakpoint delete 1
breakpoint command add 断点编号 给断点预先设置需要执行的命令,到触发断点时,就会按顺序执行
breakpoint command list 断点编号 查看某个断点设置的命令
breakpoint command delete 断点编号 删除某个断点设置的命令
(lldb) breakpoint command add 1
Enter your debugger command(s).  Type 'DONE' to end.
> po self
> p self.view.backgroundColor = [UIColor redColor]
> DONE

(lldb) breakpoint command list 1
Breakpoint 1:
    Breakpoint commands:
      po self
      p self.view.backgroundColor = [UIColor redColor]

(lldb) breakpoint command delete 1
(lldb) breakpoint command list 1
Breakpoint 1 does not have an associated command.
watchpoint
watchpoint 是一种特殊的断点,有些人也叫监视点,作用是观察变量或者属性变化。
watchpoint set variable 变量 在内存数据发生改变的时候触发
(lldb) watchpoint set variable self->_age
Watchpoint created: Watchpoint 1: addr = 0x7fdd5600a6a0 size = 4 state = enabled type = w
    watchpoint spec = 'self->_age'
    new value: 0

(lldb) c
Process 5444 resuming

Watchpoint 1 hit:
old value: 0
new value: 20
watchpoint set expression 变量的内存地址 在内存数据发生改变的时候触发
(lldb) p &self->_age
(int *) $0 = 0x00007ff53b008ab0
(lldb) watchpoint set expression 0x00007ff53b008ab0
Watchpoint created: Watchpoint 1: addr = 0x7ff53b008ab0 size = 8 state = enabled type = w
    new value: 0

(lldb) c
Process 5444 resuming

Watchpoint 1 hit:
old value: 0
new value: 20
watchpoint list 监视点列表
watchpoint disable 断点编号 禁用监视点
watchpoint enable 断点编号 启用监视点
watchpoint delete 断点编号 删除监视点
(lldb) watchpoint set variable self->_age
Watchpoint created: Watchpoint 1: addr = 0x7fabbc308100 size = 4 state = enabled type = w
    watchpoint spec = 'self->_age'
    new value: 0

(lldb) watchpoint list
Number of supported hardware watchpoints: 4
Current watchpoints:
Watchpoint 1: addr = 0x7fabbc308100 size = 4 state = enabled type = w
    watchpoint spec = 'self->_age'
    new value: 0

(lldb) watchpoint disable 1
1 watchpoints disabled.

(lldb) watchpoint list
Number of supported hardware watchpoints: 4
Current watchpoints:
Watchpoint 1: addr = 0x7fabbc308100 size = 4 state = disabled type = w
    watchpoint spec = 'self->_age'
    new value: 0

(lldb) watchpoint enable 1
1 watchpoints enabled.

(lldb) watchpoint list
Number of supported hardware watchpoints: 4
Current watchpoints:
Watchpoint 1: addr = 0x7fabbc308100 size = 4 state = enabled type = w
    watchpoint spec = 'self->_age'
    new value: 0

(lldb) watchpoint delete 1
1 watchpoints deleted.

(lldb) watchpoint list
Number of supported hardware watchpoints: 4
No watchpoints currently set.
watchpoint command add 断点编号 给监视点预先设置需要执行的命令,到触发监视点时,就会按顺序执行
watchpoint command list 断点编号 查看某个监视点设置的命令
watchpoint command delete 断点编号 删除某个监视点设置的命令
(lldb) watchpoint set variable self->_age
Watchpoint created: Watchpoint 2: addr = 0x7fabbc308100 size = 4 state = enabled type = w
    watchpoint spec = 'self->_age'
    new value: 0

(lldb) watchpoint command add 2
Enter your debugger command(s).  Type 'DONE' to end.
> p self
> DONE

(lldb) watchpoint command list 2
Watchpoint 2:
    watchpoint commands:
      p self

(lldb) watchpoint command delete 2
(lldb) watchpoint command list 2
Watchpoint 2 does not have an associated command.
image lookup
image 在操作系统里一般翻译成模块或者镜像,而不是图片。
image lookup -t 类型 查找某个类型的信息
(lldb) image lookup -t NSInteger
Best match found in /Users/feng/Library/Developer/Xcode/DerivedData/TestApp-djtlvjzlemnuhwcqyrtvxhxymeyi/Build/Products/Debug-iphonesimulator/TestApp.app/TestApp:
id = {0x7fffffff0000030a}, name = "NSInteger", byte-size = 8, decl = NSObjCRuntime.h:12, compiler_type = "typedef NSInteger"
     typedef 'NSInteger': id = {0x7fffffff00000331}, name = "long int", qualified = "long", byte-size = 8, compiler_type = "long"
image lookup -a 地址 根据内存地址查找在模块中的位置
比如我想定位发生崩溃的具体位置,为了测试先故意让程序崩溃:
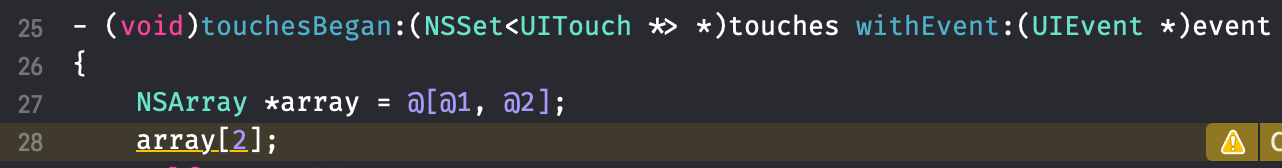
然后根据崩溃信息,拿到调用了会发生崩溃的一行代码的内存地址:

最后根据内存地址查找在模块中的位置,也就是精确到某个文件的某一行:
(lldb) image lookup -a 0x0000000102af6d09
      Address: TestApp[0x0000000100001d09] (TestApp.__TEXT.__text + 489)
      Summary: TestApp`-[ViewController touchesBegan:withEvent:] + 281 at ViewController.m:28:5
image lookup -n 符号或者函数名 查找某个符号或者函数的位置
(lldb) image lookup -n test1:test2:
1 match found in /Users/feng/Library/Developer/Xcode/DerivedData/TestApp-djtlvjzlemnuhwcqyrtvxhxymeyi/Build/Products/Debug-iphonesimulator/TestApp.app/TestApp:
        Address: TestApp[0x0000000100001b60] (TestApp.__TEXT.__text + 64)
        Summary: TestApp`-[ViewController test1:test2:] at ViewController.m:20
image list 列出所加载的模块信息
image list -o -f 打印出模块的加载顺序、偏移地址、全路径、偏移后的模块基地址
(lldb) image list -o -f
[ 0] 0x0000000000f9c000 /private/var/containers/Bundle/Application/3E9F3152-C8E5-4A2C-AB22-5BDEF538C0C7/QQ.app/QQ(0x0000000100f9c000)-
[ 0]就是模块顺序序号 -
0x0000000000f9c000是ASLR偏移地址 -
/private/var/containers/Bundle/Application/3E9F3152-C8E5-4A2C-AB22-5BDEF538C0C7/QQ.app/QQ是模块全路径 -
(0x0000000100f9c000)括号中的地址是模块基地址加上ASLR偏移地址后得到的地址,如果想要计算这个APP 的 Mach-O 文件中的基地址,就是0x0000000100f9c000 - 0x0000000000f9c000,得到0x0000000100000000
拿到APP的可执行文件模块的偏移地址(ASLR Offset)和用 IDA 反编译 Mach-O 后得到的函数地址相加就可以得到真实函数地址。
寄存器
想调试别人的APP的某个函数,可以通过反编译找到函数的地址,然后再加上 ASLR Offset 得到函数真实地址,最后用 breakpoint set -a 函数真实地址 打断点。
OC方法调用,最终通过运行时转换成了 objc_msgSend(调用者, 方法名, 参数...),所以从寄存器从读取参数时,第三个参数开始才是我们OC方法真正的参数。
memory read 读取内存指令
memory write 地址 值 给指定内存地址赋值
register read 读取所有寄存器的值
register write 寄存器 值 给指定的寄存器赋值
po $x0 或 po [$x0 class] 打印方法调用者
x/s $x1 或 p (char *)$x1 打印方法名
po $x2 打印参数(以此类推,x3 x4 也可能是参数)
p $x2 = nil 修改第一个参数的值
如果是非arm64,寄存器就是 r0、r1、r2
用 x 命令打印一个地址处存放的值
(lldb) p/x $sp
(unsigned int) $4 = 0x006e838c

(lldb) x/10 $sp
0x006e838c: 0x00000000 0x22f2c975 0x00000000 0x00000000
0x006e839c: 0x26c6bf8c 0x0000000c 0x17a753c0 0x17a753c8
0x006e83ac: 0x000001c8 0x17a75200

(lldb) x/10 0x006e838c
0x006e838c: 0x00000000 0x22f2c975 0x00000000 0x00000000
0x006e839c: 0x26c6bf8c 0x0000000c 0x17a753c0 0x17a753c8
0x006e83ac: 0x000001c8 0x17a75200
上面用 p/x 以十六进制方式打印了 SP,它是一个指针,值为 0x6e838c。而 x/10 则打印出了这个指针指向的连续10个字(word)的数据。
第三方LLDB增强工具
安装 xia0LLDB,安装后不要删除,否则会提示模块加载路径无效:
git clone https://github.com/4ch12dy/xia0LLDB.git && cd xia0LLDB && ./install.sh